📊 Community analytics dashboard in Communities
Communities now includes a powerful new Analytics dashboard that shows you exactly how your community is performing, so you can make smarter decisions about growth, content, and engagement.
A dedicated analytics section gives resellers a clear, data-backed view of community activity, from member growth and engagement to content performance and peak traffic patterns.
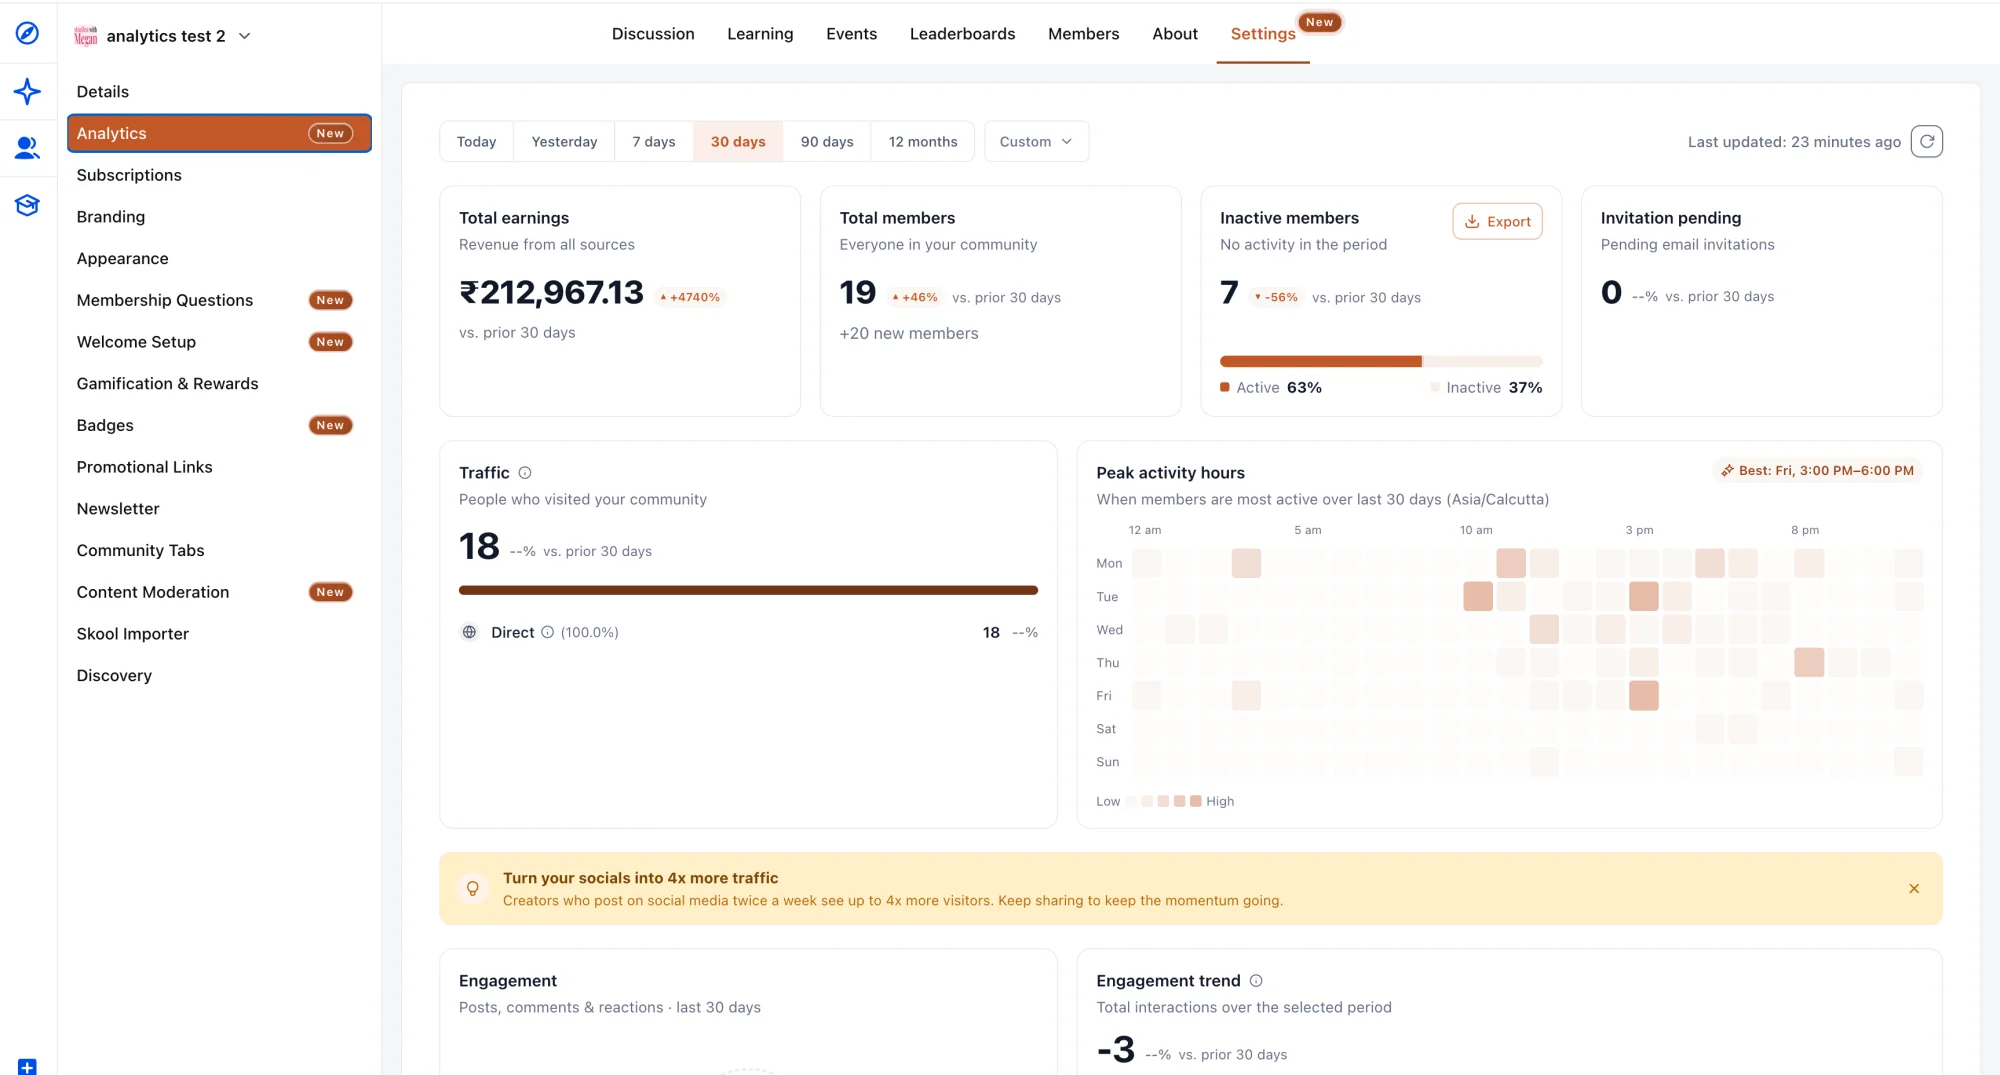
What You Can Measure
Traffic Sources
Understand where your members are coming from with a breakdown of traffic sources such as direct visits, search engines, and social channels.
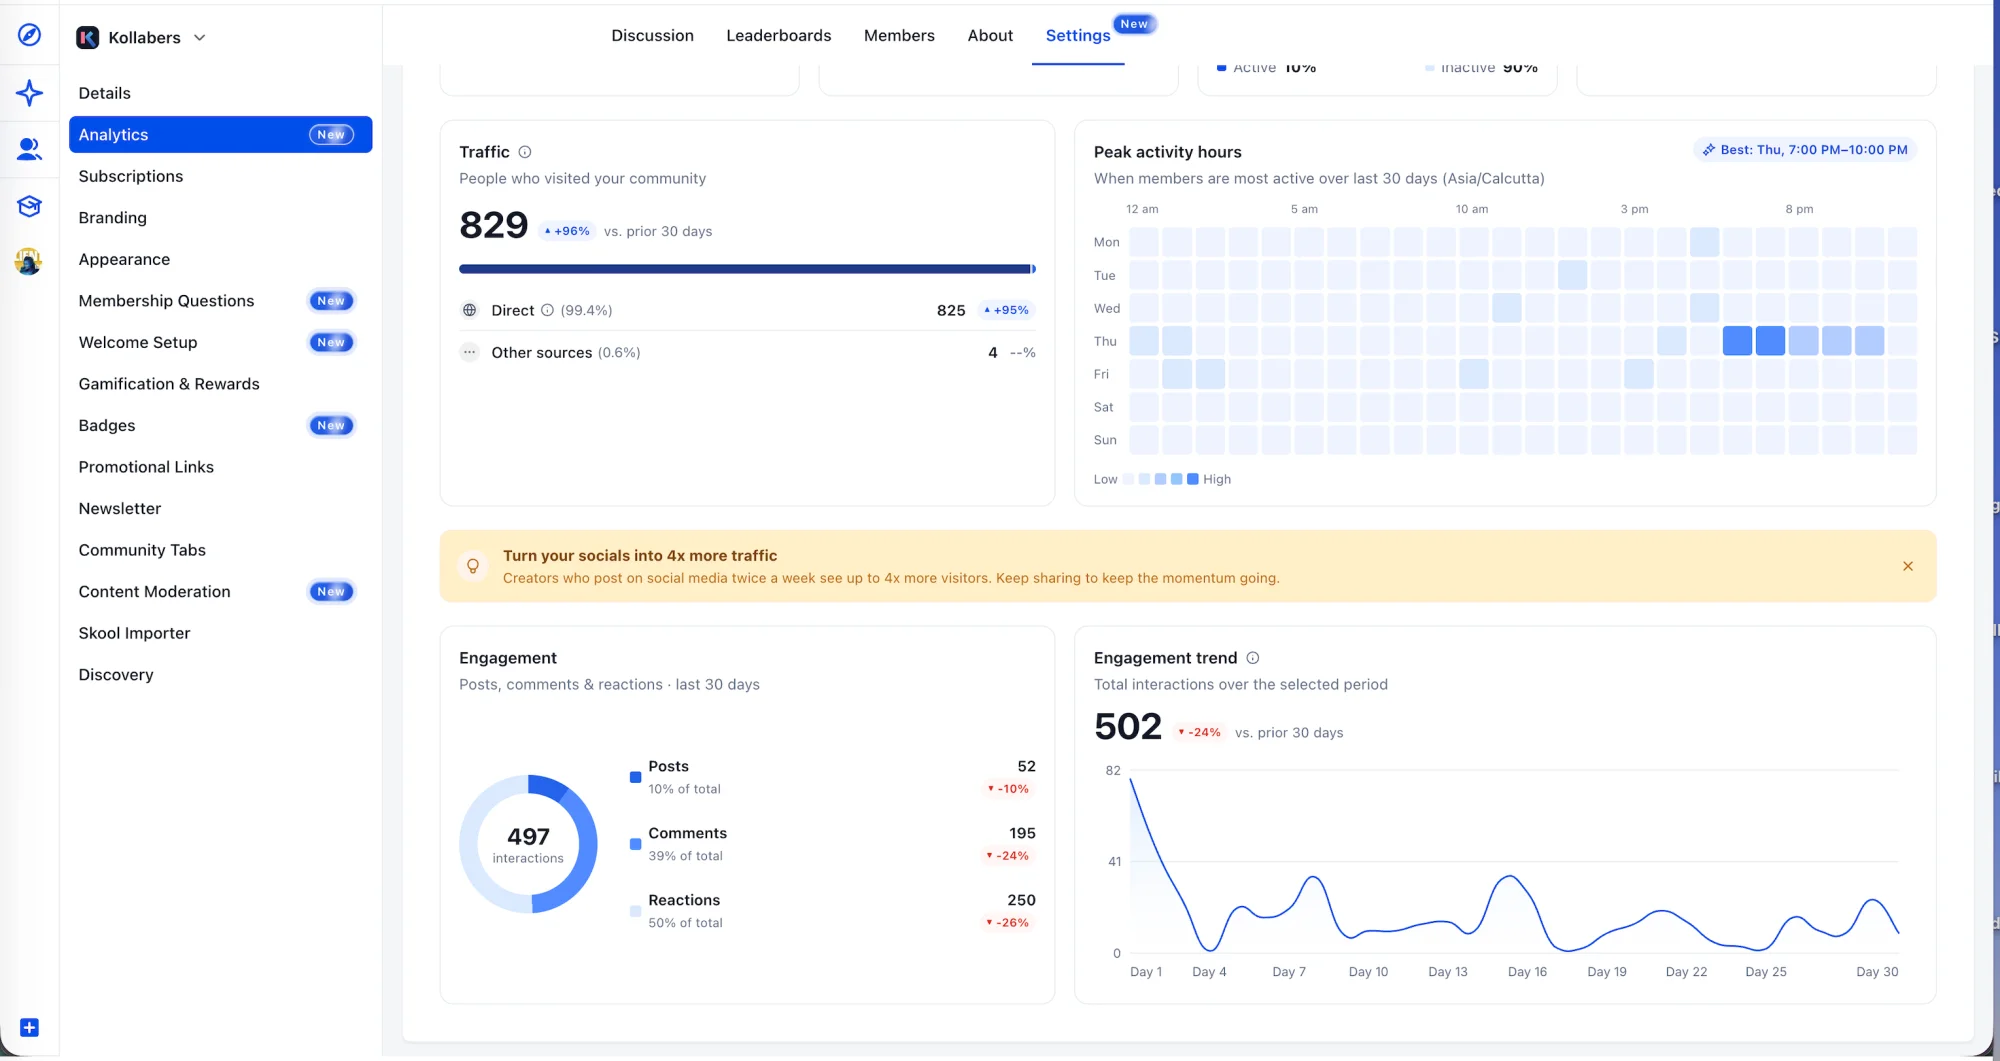
Peak Activity Hours
See the times and days when your members are most active, so you can schedule content, events, and announcements for maximum impact.
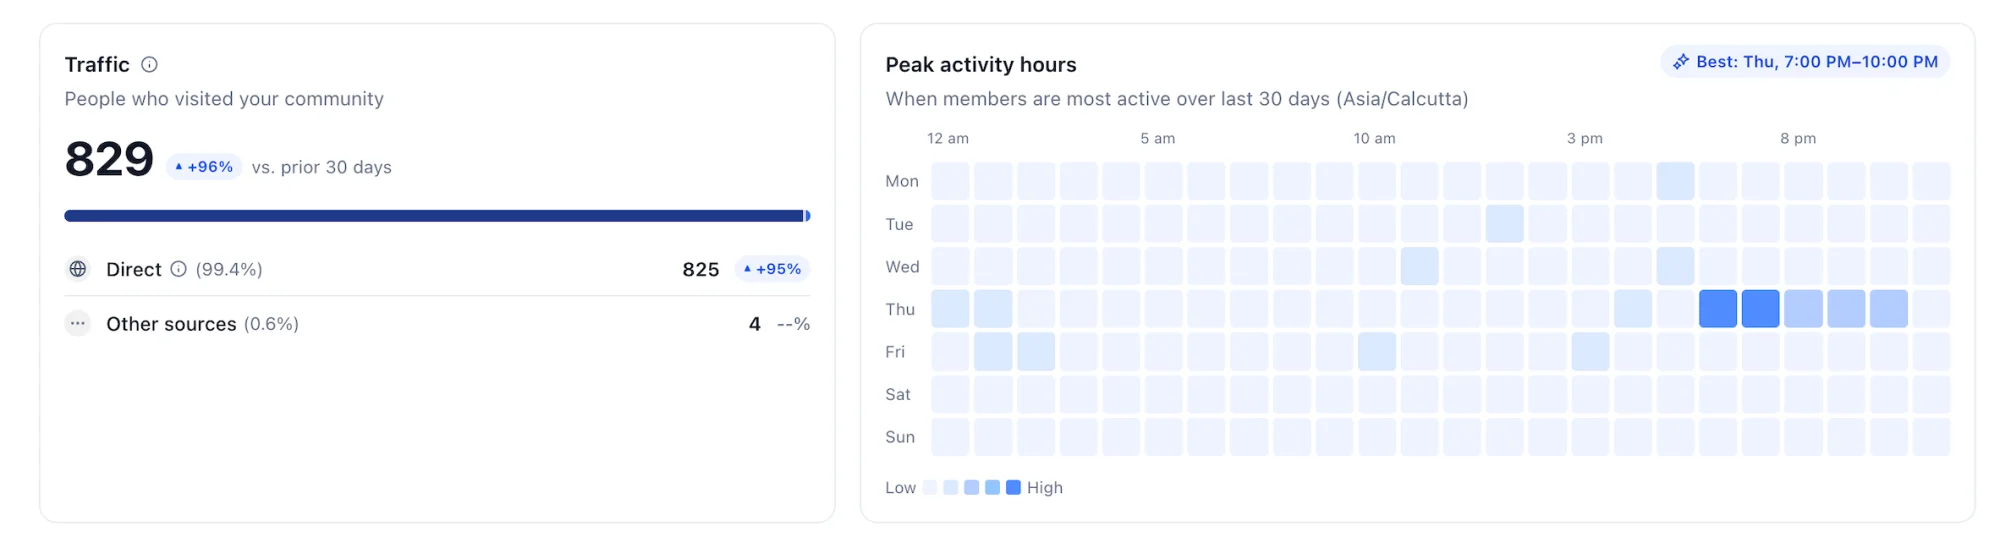
Engagement Metrics
Track how members interact with your community through key metrics, including posts, comments, reactions, and active users.
Features
- Member Growth & Activity: See how your community is growing over time and identify trends in member activity.
- Content Performance: Track which posts are getting the most views, likes, and comments.
- Engagement Rates: Measure how engaged members are with your community content.
- Member Insights: Gain a better understanding of your community members and their behavior.
- Real-time Data: Access up-to-date analytics to make informed decisions quickly.
How to Access
- Log in to your community dashboard.
- Click on the Analytics section.
- Explore traffic sources, engagement, and member activity in real time.
Why It Matters
Communities are no longer a black box. With detailed analytics, you can identify what's working, double down on high-performing content, and grow a more engaged community. Instead of guessing, you can make decisions backed by real data.